 |
|
|
|
Roche Farm & Garden
Market Data
News
Ag Commentary
Weather
Resources
|

Grain/Livestock Overview 5/22/25
OverviewThe charts are key to this analysis.You can watch any of our 47 videos on how to use the Fibonacci retracements with the ONE44 rules and guidelines to get an understanding of what is possible when retracements hold and when they do not. Soybeans November From last week,
It held the swing point for the week and fell just shy of the short term target. The low since the last update was 1030.75 and the high was 1056.75.  Corn July From last week,
The low since the last update was 442.75 and the rally from it has been 19 cents so far, we continue to look for 38.2% above.  Wheat July From last week,
The rally this week from the 528.25 swing point and major Gann square hit the short term target of 38.2% at 556.25 which is also a major Gann square. This will be the key level for the next week. 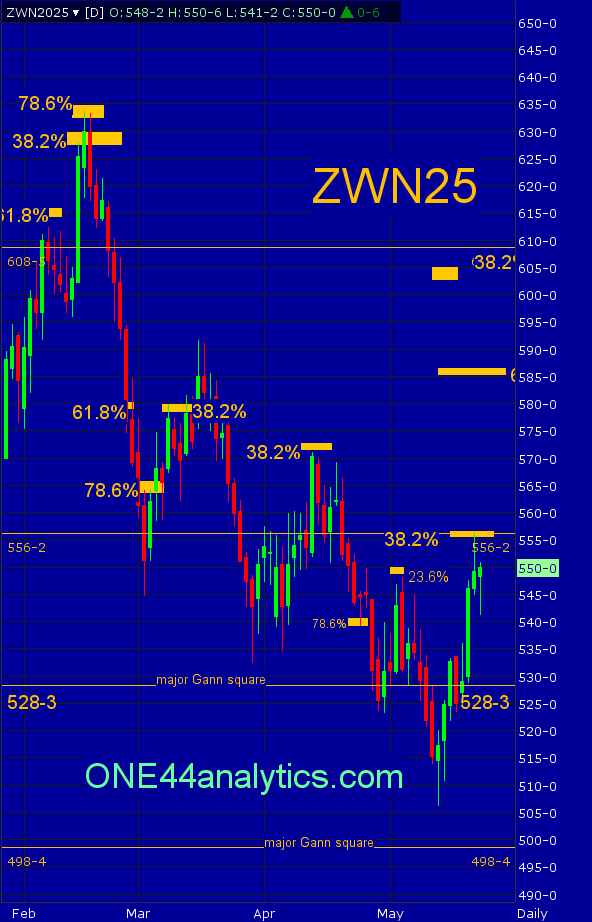 Live Cattle June From last week,
The low on the setback was 210.62 and there has been a $4.00 rally so far, we are still looking for the short term target. 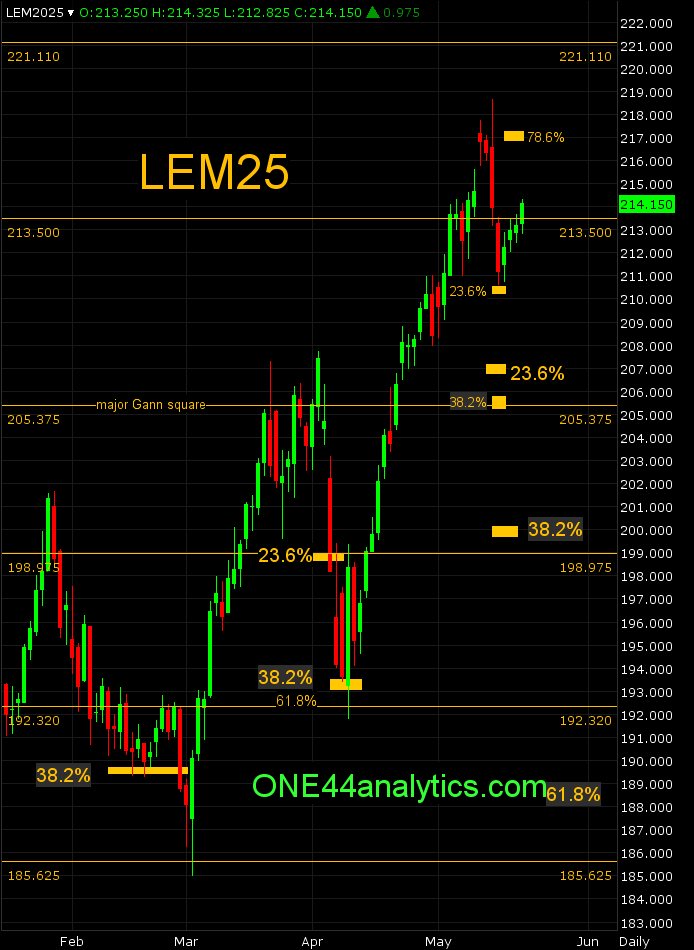 Lean Hogs June From last week,
It remains in a positive position above the 38.2% retracement and we continue to look for the short term target. 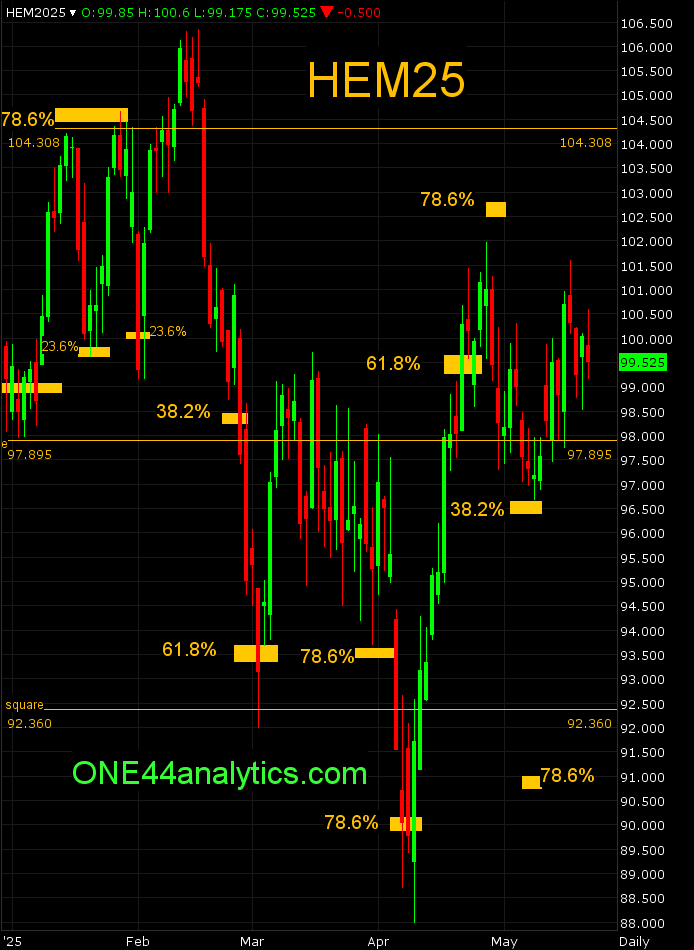 ONE44 Analytics where the analysis is concise and to the point Our goal is to not only give you actionable information, but to help you understand why we think this is happening based on pure price analysis with Fibonacci retracements, that we believe are the underlying structure of all markets and Gann squares. If you like this type of analysis and trade the Grain/Livestock futures you can become a Premium Member. You can also follow us on YouTube for more examples of how to use the Fibonacci retracements with the ONE44 rules and guidelines. Sign up for our Free newsletter here. FULL RISK DISCLOSURE: Futures trading contains substantial risk and is not for every investor. An investor could potentially lose all or more than the initial investment. Commission Rule 4.41(b)(1)(I) hypothetical or simulated performance results have certain inherent limitations. Unlike an actual performance record, simulated results do not represent actual trading. Also, since the trades have not actually been executed, the results may have under- or over-compensated for the impact, if any, of certain market factors, such as lack of liquidity. Simulated trading programs in general are also subject to the fact that they are designed with the benefit of hindsight. No representation is being made that any account will or is likely to achieve profits or losses similar to those shown. Past performance is not necessarily indicative of future results. This article contains syndicated content. We have not reviewed, approved, or endorsed the content, and may receive compensation for placement of the content on this site. For more information please view the Barchart Disclosure Policy here.
|
|
|